capital-machine-logo-r

What Oil Analysis Tells You and Why It Matters

What’s happening inside your equipment isn’t always visible from the outside.

Oil analysis provides valuable information about wear, contamination, and fluid condition by examining an oil sample in service. The results can reveal early signs of developing problems and help your team make more informed maintenance decisions.

As part of Capital Machine’s Preventative Maintenance Program, oil analysis gives you more than maintenance. It gives you information about the condition of your equipment.

Your Partner in Metal Fabrication Excellence

Oil analysis is a diagnostic tool that provides insight into what’s happening inside your equipment.

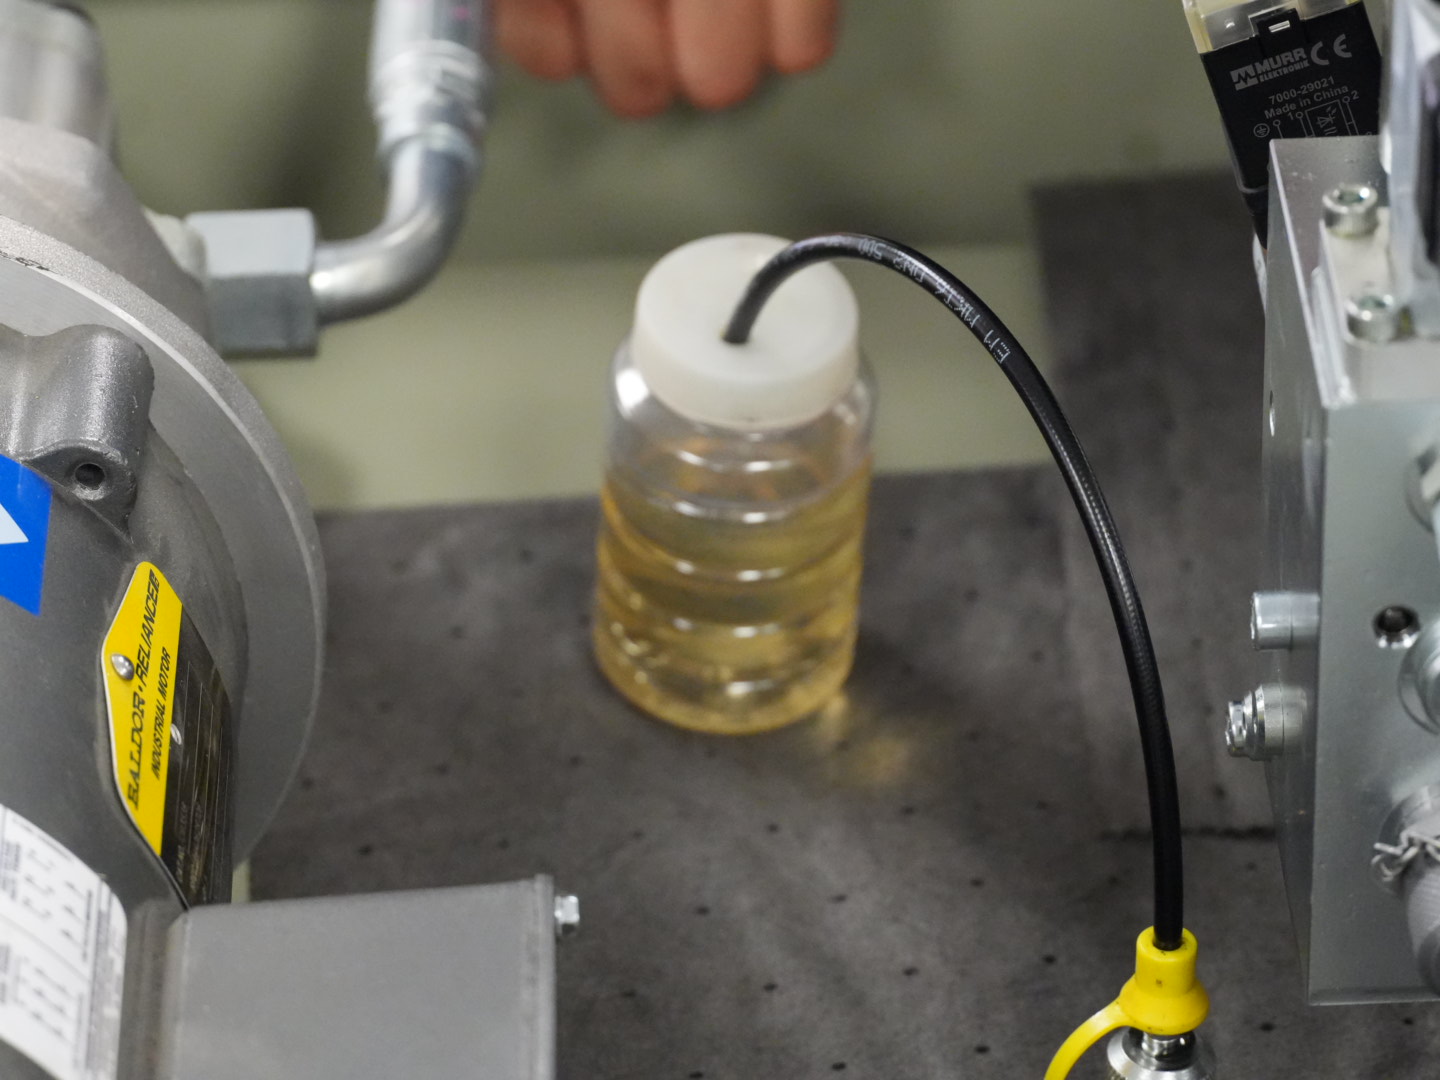
During each scheduled visit, our technicians collect an oil sample and send it to a laboratory for analysis. The sample can reveal materials and changes that point to developing issues within the machine, including:

From Sample to Report
Frame 159788776212
A representative oil sample is collected during the service visit and analyzed for wear metals, contamination, viscosity, and other indicators of fluid condition. The results are then compiled into a report that helps your team understand what the data means and determine the appropriate next steps.

What You Can Find Out With Oil Analysis

Your oil analysis report provides information across several areas that can help reveal how your equipment is performing.
Container (3)
Wear Metals

Iron, copper, chromium, lead, and aluminum in the sample.

Wear Metals
Elevated iron often points to cylinder, gear, or shaft wear. Copper suggests bushing or bearing wear. Chromium can indicate ring or liner wear on chrome-plated components. A single high reading matters less than a rising trend across samples.
Container (4)
Contamination

Dirt, coolant, fuel, and water entering the system.

Contamination
Silicon usually means dirt ingression-often a failed air filter or seal.
Sodium and potassium together point to coolant intrusion. Fuel dilution lowers viscosity and flash point. Water accelerates corrosion and depletes additives fast.
Container (6)
Fluid Condition

Viscosity, TAN, and oxidation of the base fluid.

Fluid Condition
Viscosity outside spec means the fluid can no longer maintain its protective film. TAN (Total Acid Number) measures acid buildup from oxidation - a rising TAN indicates the fluid is degrading and losing protective capacity.
Container (5)
Trending

One sample is a data point. Several are a trend.

Trending
A single elevated reading can be noise. Two or three consecutive increases are signal. Establish a baseline at commissioning or first sample, then watch the rate of change over time - not just where the number sits today.

What You Can Find Out With Oil Analysis

Below is a sample oil analysis report showing the types of information available through laboratory testing.

Explore the highlighted areas to see what different readings can tell you about equipment condition, wear, contamination, and fluid performance.

The goal is to turn laboratory data into practical information your team can use to make better maintenance decisions.

Apex Oil Lab · Oil Analysis Report
Unit ID
4654
Model
AccuPress 710010
Machine Type
Hydraulic
Sample ID
1A9C4AC
Sampled
16 Apr 2026
Oil
Hydraulic AW 46
Text
Overall Status: OK — All elements acceptable, suitable for continued use, resample at normal intervals.
Parameter
Result
Reference
Status
Wear Metals
ASTM D6595-00
Iron (Fe)
1 ppm
Ref ≤ 15
Normal
On a press brake, wear metal mainly comes from the main cylinder rod, gland, and pump gears. At 1 ppm this is baseline — well below the 15 ppm alert level and consistent with normal running clearances.
Copper (Cu)
2 ppm
Ref ≤ 10
Normal
Lead (Pb)
1 ppm
Ref ≤ 5
Normal
Aluminium (Al)
1 ppm
Ref ≤ 5
Normal
Chrome (Cr)
1 ppm
Ref ≤ 3
Normal
Contaminants
ASTM D6595-00
Silicon (Si)
1 ppm
Ref ≤ 10
Normal
Silicon at this level shows the reservoir breather and cylinder rod seals are keeping dirt out. It rarely comes from the fluid itself-watch this number after any hose or seal work on the press.
Sodium (Na)
1 ppm
Ref ≤ 15
Normal
Potassium (K)
1 ppm
Ref ≤ 10
Normal
Fluid Condition
ASTM D445 / ASTM E2412
Viscosity @ 40°C
46.5 cSt
Ref 41.4–50.6
Normal
This press brake runs ISO VC 46 hydraulic fluid, so viscosity should stay close to 46 cSt. Staying inside range keeps the servo valves and proportional controls responding the way they were tuned for.
TAN
0.36 mg KOH/g
Ref ≤ 0.50
Normal
TAN (Total Acid Number) measures the acid buildup that forms as hydraulic fluid oxidizes. A rising TAN indicates fluid degradation and additive depletion -0.36 is still under the 0.50 limit, but track this number sample over sample, not just this one reading.
Water
37.6 ppm
Ref ≤ 200
Normal
Water in a press brake’s hydraulic system usually enters through the reservoir breather or a worn cylinder rod seal. At 37.6 ppm this fluid is dry — well clear of the level where it would start accelerating corrosion or depleting additives.
Oxidation By-Products
12.1 Abs/0.1mm
Ref ≤ 15
Normal
Oxidation by-products build up as the base oil breaks down chemically, and TAN typically rises right alongside them. At 12.1 Abs/0.1mm there is still headroom before the limit, but read the two numbers together.
Particle Count
ISO 4406 / MET-MEC-015
ISO Code
17/15/11
Ref ≤ 16/14/11
Watch
17/15/11 means this sample carries more mid-size particles (4-6 μm) than the 16/14/11 target for this press brake's servo- valve circuit. Those valves run tight clearances, so particulate this size can affect precision positioning before it shows up as a mechanical fault.
Particles >4µm
785 part./ml
Ref ≤ 640
Watch
785 particles/mL is running above the 640 target. This channel catches the smallest, earliest contamination - often the first sign filtration is starting to fall behind, before larger particles show up.
Particles >6µm
223 part./ml
Ref ≤ 160
Watch
223 particles/mL is also above target. Combined with the elevated 4 um count, this points to filtration efficiency slipping rather than a single contamination event-check filter condition and change interval.
Particles >14µm
17 part./ml
Ref ≤ 20
Normal
Cutting particles
1.5 part./ml
Ref ≤ 5
Normal
Sliding particles
4.6 part./ml
Ref ≤ 10
Normal
Fatigue particles
7.7 part./ml
Ref ≤ 15
Normal
Cutting, sliding, and fatigue particles describe the shape and origin of wear debris under microscopic analysis. Fatigue particles come from surface spalling - usually bearings or gear teeth under repeated load. All three are normal here, but a rising fatigue count is one of the earliest warnings of a bearing heading toward failure.

Turn Oil Analysis Into Action

Oil analysis isn’t just about what’s happening inside the lab. The real value comes from using that information to make better decisions in the field.

Deburring & Finishing
Typical early-warning window: 4 weeks
Trend data can provide an opportunity to identify developing wear before it becomes a more serious equipment failure.
Condition-Based Service
Longer service intervals when conditions allow
When trend data shows that fluid remains within specification, your team can make maintenance decisions based on condition rather than changing oil simply because it’s on the calendar.
Planned vs. Unplanned Costs
Unplanned repairs can cost significantly more than planned maintenance
Catching an issue early can give your team time to schedule the repair, plan for parts and labor, and avoid the added costs associated with an unexpected failure.
Without Oil Analysis
With Oil Analysis

From Information to Better Maintenance Decisions

Oil analysis has long been used to monitor the condition of critical equipment, including aircraft engines and other high-performance systems.
The principle is simple: understanding what is happening inside a machine gives you more information to make decisions before a failure occurs.
Capital Machine brings that same condition-focused approach to metal fabrication equipment. By combining laboratory oil analysis with on-site inspections and condition reporting, we help you better understand your equipment and plan maintenance with greater confidence.
DSC04963
Oil changes maintain the machine. Oil analysis gives you information about the machine.

Put Your Equipment Data to Work

Oil analysis gives you a clearer picture of what’s happening inside your equipment and helps turn that information into action.
Capital Machine combines oil analysis with scheduled preventative maintenance, multi-point inspections, and condition reporting to help you identify concerns, plan maintenance, and make more informed decisions about your equipment.

Subscribe Newsletters